Returns for the global 60/40 portfolio are positive again, reaffirming its benefits.
A globally diversified portfolio of 60% stocks and 40% bonds declined by about 16% in 2022—a painful period for balanced investors that raised doubts about the viability of this strategy. 1 Some commentators even declared the old standby dead.
Yet, by the end of September 2024, the global 60/40 was back in positive territory, with a 29.7% cumulative return since year-end 2022. 2 Even accounting for 2022, the 10-year trailing annualised return of the 60/40 was 6.9% over the past decade, 10 basis points above its long-term average. 3
Falling equity valuations and rising bond yields have given way to an improved return outlook. While strong equity returns had an outsized impact on the 60/40 portfolio over the last decade and have driven valuations back to high levels, we expect to see more proportional contributions from each asset class over the next 10 years.
A solid long-term track record
“The fact of the matter is that the long-term track record of the 60/40 has been consistently strong,” said Todd Schlanger, CFA, a senior investment strategist.
“Though unusual, it’s not unprecedented to see stocks and bonds decline in tandem. Even so, the 60/40 portfolio can be a wise choice for clients with a moderate risk tolerance seeking broad diversification and a track record of solid long-term results.”
The strength of the 60/40 can be seen in the figure below, which plots the portfolio’s 10-year rolling returns dating back to 1997. While the strategy has had its good and bad years—returns ranged from +37% to –30% during the Global Financial Crisis—the 10-year returns have been much more stable.
Returns of the 60/40 portfolio over time
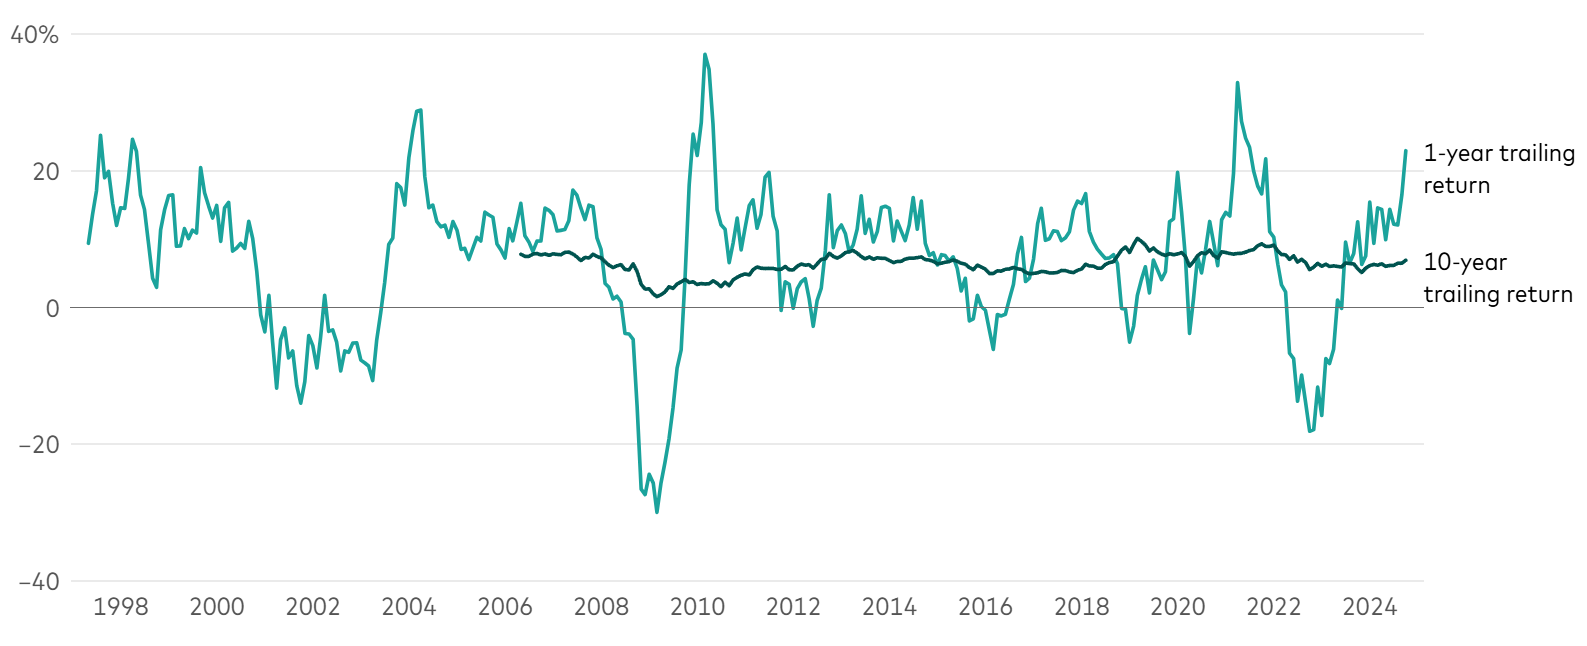
Note: For information about the proxies used in the globally diversified 60/40 portfolio, please see index descriptions in footnote 1.
Source: Vanguard calculations, based on data from Standard & Poor’s, MSCI, and Bloomberg.
Diversification drives the 60/40 portfolio’s long-term consistency. By design, and due to the global broad market exposure that yields diversification across and within asset classes, the strategy’s yearly performance is usually near the middle relative to the various segments of the global capital markets, as shown in the figure below.
Even in its worst years of absolute returns, such as 2022, the 60/40 portfolio rank relative to slices of the global capital markets was, predictably, about average.
It is the relative consistency of these yearly returns over time that compounds into this competitive long-term track record.
Diversification is the key to the 60/40 portfolio’s success
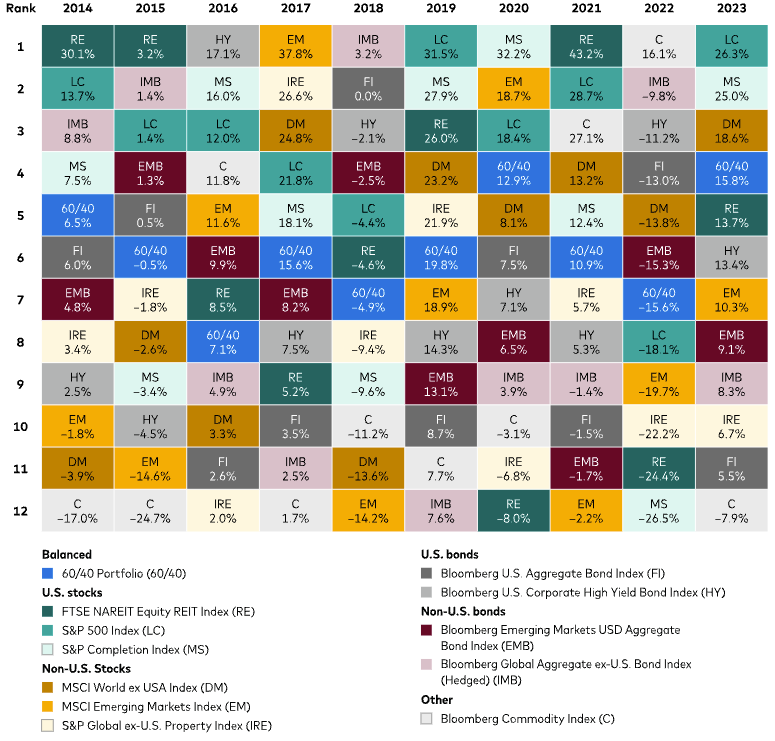
Notes: Large-cap U.S. stocks are represented by the S&P 500 Index, mid-cap and small-cap U.S. stocks by the S&P Completion Index, developed non-U.S. stock markets by the MSCI World ex USA Index, and emerging markets by the MSCI Emerging Markets Index. Commodities are represented by the Bloomberg Commodity Index, U.S. real estate by the FTSE NAREIT Equity REIT Index, and non-U.S. real estate by the S&P Global ex-U.S. Property Index. U.S. investment-grade bonds are represented by the Bloomberg U.S. Aggregate Bond Index, U.S. high-yield bonds by the Bloomberg U.S. High-Yield Bond Index, non-U.S. bonds by the Bloomberg Global Aggregate ex-U.S. Bond Index (Hedged), and emerging markets bonds by the Bloomberg Emerging Market USD Aggregate Index. The 60/40 Portfolio is represented by the indexes listed in the proxy description in footnote 1. The Spliced Total Stock Market Index includes the MSCI U.S. Broad Market Index through June 2, 2013, and the CRSP US Total Market Index thereafter.
Sources: Vanguard calculations, using data from FactSet.
It’s easy to get caught up in the noise and year-to-year absolute returns. That is why we encourage investors to focus on what they can control—their goals, asset allocation, costs, and discipline in implementing their investment strategy.
The strategic asset allocation and “steady as it goes” results of a globally diversified balanced portfolio are a great starting place for long-term investors, and that is as true today as any time in history.
The 60/40 portfolio has been a remarkably consistent performer over the long-term, and with the tailwind of higher bond yields and a more balanced outlook, we see it as poised for another strong decade of results.
Notes:
All investing is subject to risk, including the possible loss of the money you invest.
Be aware that fluctuations in the financial markets and other factors may cause declines in the value of your account. There is no guarantee that any particular asset allocation or mix of funds will meet your investment objectives or provide you with a given level of income.
Diversification does not ensure a profit or protect against a loss.
Investments in bonds are subject to interest rate, credit, and inflation risk.
Investments in stocks or bonds issued by non-U.S. companies are subject to risks including country/regional risk and currency risk. These risks are especially high in emerging markets.
Past performance is not a guarantee of future results. The performance of an index is not an exact representation of any particular investment, as you cannot invest directly in an index.
IMPORTANT: The projections and other information generated by the Vanguard Capital Markets Model® regarding the likelihood of various investment outcomes are hypothetical in nature, do not reflect actual investment results, and are not guarantees of future results. VCMM results will vary with each use and over time.
The VCMM projections are based on a statistical analysis of historical data. Future returns may behave differently from the historical patterns captured in the VCMM. More importantly, the VCMM may be underestimating extreme negative scenarios unobserved in the historical period on which the model estimation is based.
The VCMM is a proprietary financial simulation tool developed and maintained by Vanguard’s primary investment research and advice teams. The model forecasts distributions of future returns for a wide array of broad asset classes. Those asset classes include U.S. and international equity markets, several maturities of the U.S. Treasury and corporate fixed income markets, international fixed income markets, U.S. money markets, commodities, and certain alternative investment strategies. The theoretical and empirical foundation for the Vanguard Capital Markets Model is that the returns of various asset classes reflect the compensation investors require for bearing different types of systematic risk (beta). At the core of the model are estimates of the dynamic statistical relationship between risk factors and asset returns, obtained from statistical analysis based on available monthly financial and economic data from as early as 1960. Using a system of estimated equations, the model then applies a Monte Carlo simulation method to project the estimated interrelationships among risk factors and asset classes as well as uncertainty and randomness over time. The model generates a large set of simulated outcomes for each asset class over several time horizons. Forecasts are obtained by computing measures of central tendency in these simulations. Results produced by the tool will vary with each use and over time.
[1] Vanguard calculations, based on data from Standard & Poor’s, MSCI, and Bloomberg, for the period from January 1, 2022, through December 31, 2022. For the globally diversified 60/40 portfolio, we used the following proxies: for U.S. stocks, a 36% weighting in the CRSP US Total Market Index; for non-U.S. stocks, a 24% weighting in the FTSE Global All Cap ex US Index; for U.S. bonds, a 28% weighting in the Bloomberg U.S. Aggregate Float Adjusted Bond Index; and for non-U.S. bonds, a 12% weighting in the Bloomberg Global Aggregate Float Adjusted ex-USD Index.
[2] Vanguard calculations, based on data from Standard & Poor’s, MSCI, and Bloomberg, for the period from December 30, 2022, to September 30, 2024. For information about the proxies used in the globally diversified 60/40 portfolio, see footnote 1. Past performance is no guarantee of future returns. The performance of an index is not an exact representation of any particular investment, as you cannot invest directly in an index.
[3] Vanguard calculations, based on data from Standard & Poor’s, MSCI, and Bloomberg, for the period from January 1, 1997, through September 30, 2024. For the globally diversified 60/40 portfolio, we used the following proxies: for U.S. stocks, a 36% weighting in the Dow Jones U.S. Total Stock Market Index (formerly known as the Dow Jones Wilshire 5000 Index) through April 22, 2005, the MSCI US Broad Market Index through June 2, 2013, and the CRSP US Total Market Index thereafter; for non-U.S. stocks, a 24% weighting in the Total International Composite Index through August 31, 2006, the MSCI EAFE + Emerging Markets Index through December 15, 2010, the MSCI ACWI ex USA IMI Index through June 2, 2013, and the FTSE Global All Cap ex US Index thereafter; for U.S. bonds, a 28% weighting in the Bloomberg U.S. Aggregate Float Adjusted Bond Index; and for non-U.S. bonds, a 12% weighting in the Bloomberg Global Aggregate Float Adjusted ex-USD Index.