
Getting on top of your finances is one of the most common new year’s resolutions. But sticking to them can be hard. If you want to get your finances unstuck, here’s five money tasks you can tick off during your summer down time, that will help set you up for success this year. Check your ... Read more

We plan for holidays, home renovations, and retirement but we’re less likely to plan for the unexpected. Life insurance is one quiet but powerful way to protect the people you love from financial stress if something happens to you. Whether you’re raising a family, supporting a partner, or building a business, life insurance helps ensure ... Read more

Self-managed superannuation fund (SMSF) trustees always have a lot on their to-do lists but the first few months of 2026 are likely to be busier than usual. Topping the list is preparing for the introduction of Payday Super and the Better Targeted Superannuation Concessions on 1 July 2026. Payday Super is a change to when ... Read more

A sudden death can place financial stress on those who depend on you. If this happens, life cover can help them pay the bills and other living expenses. What is life cover Life cover is also called ‘term life insurance’ or ‘death cover’. It pays a lump sum amount of money when you die. The ... Read more

Men are earning on average A$9,753 more than women each year in the form of performance bonuses, allowances and overtime pay. That’s according to the latest gender pay gap data released on Thursday by the Workplace Gender Equality Agency. It covers more than 8,000 private companies for 2024–25, employing more than 5.4 million workers across ... Read more

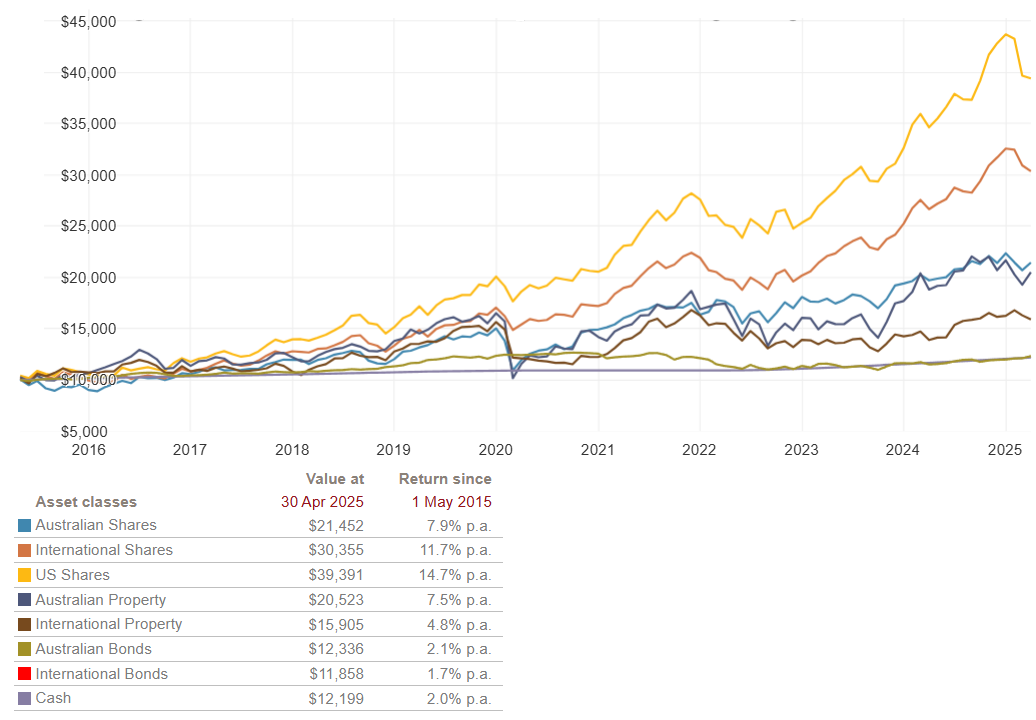
Investing may be all about the numbers – growth, returns and risk – to build a secure future but increasingly investors are interested in an even more meaningful approach. Four out of five respondents to a 2024 survey wanted their investments to have a positive impact in the world.i The survey, by the Responsible Investment ... Read more

Few investment sectors combine geopolitical intrigue, technological innovation and long-term growth potential quite like rare earth elements (REEs). For Australians, the recent deal with the United States to supply rare earths to seed US$8.5 billion worth of new projects, has thrust the sector into the spotlight.i What are rare earths? Rare earth elements are a ... Read more

Retirement has often been seen as a time to slow down and enjoy the simple pleasures of daily life. And for many, that’s the dream. But retirement is no longer defined by one image or one path. In fact, it can be something much more expansive. Today, retirement is increasingly viewed as a time of ... Read more

Recently, there was an alert about the ASIC Moneysmart website being impersonated. It’s part of a growing – and increasingly sophisticated – trend of scammers targeting reputable, high traffic websites. These days, websites can be very easily set up and look quite professional without much effort, thanks to templates. So, whether you’re visiting the website ... Read more

Ageing comes with wisdom, experience and a lifetime of stories, but it can also bring new challenges. Tasks that once felt effortless may now require support, and while many people assume the only option is moving into residential care, that isn’t the case. You can often receive the help you need while continuing to live ... Read more


